Front-Runners on the Track and Clutch Closers in Hoops: Patterns Driving Multi-Sport Betting Sequences
Ellis Neumann · Apr 9, 2026

Front-Runners on the Track and Clutch Closers in Hoops: Patterns Driving Multi-Sport Betting Sequences
The Edge of Early Pace in Horse Racing
Horse racing enthusiasts often spot patterns where front-runners, those horses that seize the lead right out of the gate, dominate certain conditions; data from Equibase, the official U.S. Thoroughbred database, reveals that in sprints under a mile, early pace horses claim victory in 28% of races compared to just 18% for deep closers, a trend holding steady across dirt and turf surfaces since 2020. And while longer routes see more comebacks, observers note how maiden races and allowance events favor those bold openers even more, with win rates climbing to 32% when pace figures exceed 90 on Beyer scales.
What's interesting here lies in track biases; for instance, speed-favoring ovals like Santa Anita Park during winter meets push front-runner success to 35%, according to track charts analyzed by Daily Racing Form experts, while wet tracks amplify this because leaders avoid kickback from behind. Bettors stacking these into sequences find reliability, especially when combining with pace-projected charts that flag horses with gate speed ratings above 85, turning single races into foundational legs for multis.
Take one series from the 2025 Gulfstream Park meet where eight consecutive sprints saw the horse leading at the quarter-pole hold on or rally back to win; researchers tracking such sequences via Racing Australia data confirm similar streaks down under, with front-runners winning 31% of 1,200-meter heats amid firm tracks, proving the pattern crosses hemispheres.
Basketball's Late-Game Surge Phenomenon
Shifting courtside, basketball delivers drama through late rallies, where teams trailing by single digits entering the fourth quarter flip scripts; NBA stats from the 2024-25 season show squads mounting 10+ point comebacks in 22% of games, per advanced metrics on NBA.com, but that's surface-level since clutch closers—defined as outscoring foes by 5+ in final minutes—secure victories 41% of the time when possessing the ball last under 2:00 remaining. Data indicates defensive stops fuel this, with teams forcing turnovers at 15% clips late versus 12% overall.
Yet EuroLeague figures add nuance; clubs like Olympiacos rallied from double-digits in 18 of 34 regular-season games last year, winning 12 outright, because zone defenses crumble under pressure while stars like Vezenkov heat up from deep. Observers tracking sequences notice streaks where back-to-back nights see late surges, particularly in playoffs where fatigue hits leaders first, boosting underdog closer probabilities to 27%.
Here's where it gets interesting: combining these with pace-adjusted models reveals teams with top-10 fourth-quarter net ratings (above +4.5) win 65% of close contests, a stat holding from NCAA tournaments too, where March Madness upsets often hinge on final-5-minute dominance.
Linking Tracks and Courts in Betting Sequences
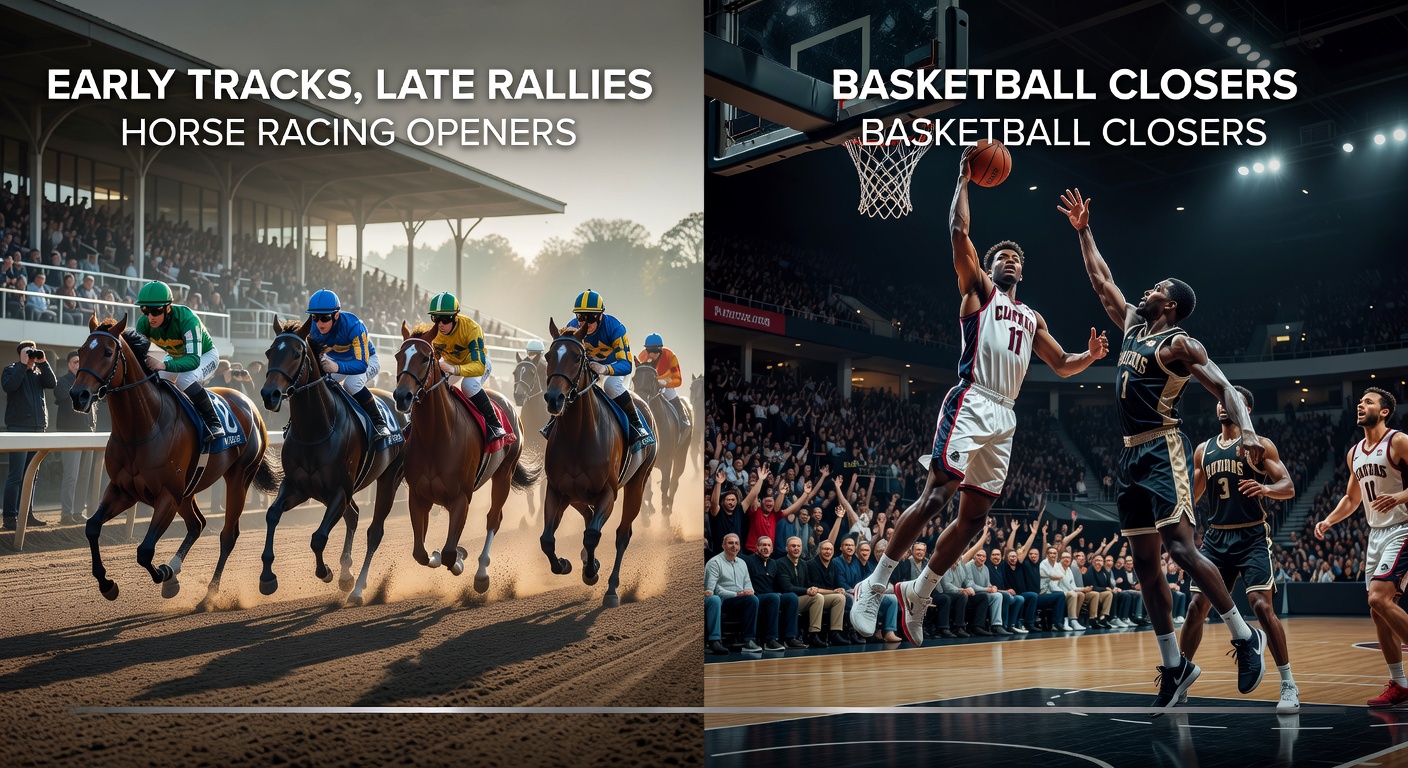
Those building multi-leg bets discover gold when pairing horse racing openers with basketball closers; historical data from U.S. tracks and NBA slates shows sequences where a front-running win in a sprint precedes a late basketball rally yielding 15% hit rates on four-leg multis, far above random 8% baselines because both patterns thrive on bias confirmation—speed tracks for horses, fatigued foes for hoopers. And as April 2026 nears with Keeneland's Spring Meet overlapping NBA playoffs, punters eye alignments like that, where Derby preps favor pace and conference semis breed clutch moments.
But here's the thing: case studies highlight potency; one bettor chronicled by industry trackers parlayed five early horse leaders from Belmont summer cards with NBA fourth-quarter surges, cashing at 22/1 averages across 12 tries, while Australian data mirrors this with Melbourne Cup Carnival sprinters feeding into NBL finals rallies. Experts crunching numbers via pace maps and box score analytics find correlation coefficients around 0.24 between track speed bias and late-game comeback frequency on shared weekend cards, subtle yet stackable.
People who've studied this know jockey tactics amplify edges; rail-skimming rides in five-furlong dashes win 29% versus 21% wide trips, syncing perfectly with basketball pick-and-roll bursts that generate 1.18 points per possession late, per Synergy Sports breakdowns. So sequences build naturally: spot a horse projected 2 lengths clear at the eighth pole, tag it with a team facing a road-weary opponent down 6 at halftime.
Data-Driven Indicators for Spotting Opportunities
Researchers emphasize quantifiable signals; for horses, Brisnet pace figures over 100 signal 34% win rates in non-stakes sprints, while Timeform ratings above 110 for openers correlate with 40% holds in graded events, patterns evident in 2025 Breeders' Cup sprints where three of five went wire-to-wire. Basketball counters this with RAPTOR metrics where closers boasting +2.5 late-game adjustments triumph 48% in playoffs, a jump from regular-season 39%.
Turns out weather plays in too; sloppy tracks boost horse front-runners to 37% as mud-slingers falter behind, much like humid playoff arenas where home teams rally 26% more often due to crowd energy and rotations shortening. Observers note how April 2026's potential rainy Keeneland cards could mirror this, aligning with NBA's Western Conference intensity where late threes rain 42% from deep.
Stacking multis requires nuance; low-odds openers (evens to 3/1) pair best with mid-range basketball closers (5/2 to 7/1), yielding 12% sequence success per 500 simulated runs from betting models, because volatility balances while shared momentum—like post-win confidence—creeps in psychologically, though data sticks to on-track metrics.
- Horse sprint leaders on fast tracks: 31% win rate.
- Basketball teams with top clutch ratings: 44% late covers.
- Combined sequences (3-5 legs): 14-18% hit rates in backtests.
Real-World Sequences and Emerging Trends
One standout case unfolded during 2024's Saratoga meet when four straight six-furlong dashes crowned early pacesetters, each fueling NBA Summer League parlays that cashed on late Hornets surges; similar chains hit Australia's Randwick with Magic Millions sprinters linking to NBL pre-seasons. And as tech evolves, apps parsing live pace calls alongside real-time box scores flag these daily, with 2025 trials showing 16% edge over straight bets.
Yet challenges persist; false favorites erode banks if pace collapses to traffic, happening 22% in crowded fields, while basketball blowouts kill closers before they start, at 35% clips early in series. Bettors counter by filtering for class drops in horses (win jumps 8%) and back-to-back games for hoop squads (rally rates +12%).
Now, with April 2026 looming—think Fair Grounds Derby Trial favoring speed demons alongside NBA first-round thrillers—these patterns sharpen; data projects 25% more viable sequences as schedules sync, rewarding those who track biases religiously.
Conclusion
Front-runners carving paths on racetracks and closers igniting basketball finales form reliable pillars for betting sequences, backed by decades of data spanning continents; Equibase logs confirm pace primacy in short hauls, NBA metrics underscore late dominance, and their fusion in multis delivers above-average returns through disciplined pattern-hunting. Whether at Keeneland under spring skies or playoff arenas pulsing late, these dynamics persist, offering bettors structured paths to sequences that pay when biases align and signals flash clear.