Cross-Sport Momentum Patterns: How Cycles in Soccer, Tennis, and Horse Racing Form Layered Multiple Frameworks
Mia Griffin · Jul 12, 2026

Cross-Sport Momentum Patterns: How Cycles in Soccer, Tennis, and Horse Racing Form Layered Multiple Frameworks
Performance cycles appear across multiple sports as measurable streaks of form that athletes and teams exhibit over time, and researchers track these patterns through statistical models that quantify consistency, recovery periods, and peak output phases. Data from longitudinal studies reveal that soccer players often sustain elevated passing accuracy and goal conversion rates for three to five matches before regression sets in, while tennis competitors display serve win percentages that fluctuate in blocks tied to tournament scheduling. Horse racing records show similar clustering where certain trainers and jockey combinations deliver above-average strike rates during specific meet sequences.
These cycles gain additional complexity when observers examine how rest intervals, travel demands, and opponent strength interact with baseline skill levels. In soccer, mid-season fixture congestion correlates with measurable drops in sprint distance covered, according to tracking data collected by European leagues. Tennis schedules produce analogous effects during extended clay or grass swings, where surface transitions influence rally lengths and error rates in documented patterns. Racing analysts note that horses returning from layoffs exhibit distinct speed figure progressions that stabilize after two to three outings.
Soccer Form Sequences and Their Measurable Components
Soccer performance data collected across major leagues demonstrates that teams entering periods of positive goal difference often maintain elevated expected goals metrics for consecutive weekends, yet these runs rarely exceed eight matches without interruption from injuries or tactical adjustments. Midfielders and forwards show distinct recovery curves following high-intensity blocks, with heart rate variability metrics returning to baseline within 72 hours in most documented cases. Defensive units meanwhile exhibit tackle success percentages that align with collective training load distributions tracked by club sports science departments.
July 2026 pre-season schedules introduce additional variables as squads integrate new signings and test tactical systems ahead of competitive fixtures. Performance analysts record how early friendly results sometimes forecast opening league momentum, though correlation coefficients remain moderate across large datasets. Layered multiple structures in this context refer to combinations that stack outcomes from sequential matchdays, where each leg reflects distinct phases of team form cycles rather than isolated events.
Tennis Rally and Set Momentum Indicators
Tennis momentum manifests through serve hold percentages and break point conversion rates that shift during extended matches, with data from Grand Slam tournaments indicating that players who secure the first set maintain second-set win probabilities around 65 percent on average. Surface-specific adaptations produce further differentiation, as hard-court rallies generate higher ace frequencies compared with slower clay exchanges. Recovery between tournaments influences these metrics, since players traveling across time zones display measurable declines in first-serve accuracy during initial rounds.
Performance tracking systems capture point-by-point sequences that reveal momentum shifts lasting two to four games before equilibrium returns. These patterns feed into layered multiple constructions by allowing selectors to combine legs from different tournament stages, where early-round consistency pairs with later-stage fatigue indicators. Researchers studying elite competitors note that best-of-five formats amplify the visibility of these cycles compared with shorter best-of-three encounters.
Horse Racing Speed and Class Progression Patterns
Horse racing performance cycles emerge through speed ratings and class adjustments that evolve across race distances and track conditions. Records from major circuits indicate that three-year-olds frequently improve their figures over a four-race window before plateauing, while older horses display more stable but shorter streaks tied to seasonal peaks. Jockey-trainer partnerships contribute additional layers, with strike rate data showing elevated success during specific meeting clusters at individual tracks.
July 2026 summer festivals feature extended programs where ground conditions and field sizes introduce variability that analysts quantify through going allowances and sectional timing. These elements align with soccer and tennis cycles when layered multiples incorporate outcomes from consecutive race days, each leg reflecting distinct stages of equine freshness or cumulative fatigue. Veterinary and training records provide supporting context for how recovery periods between starts influence subsequent performance outputs.
Alignment Mechanisms Across the Three Disciplines
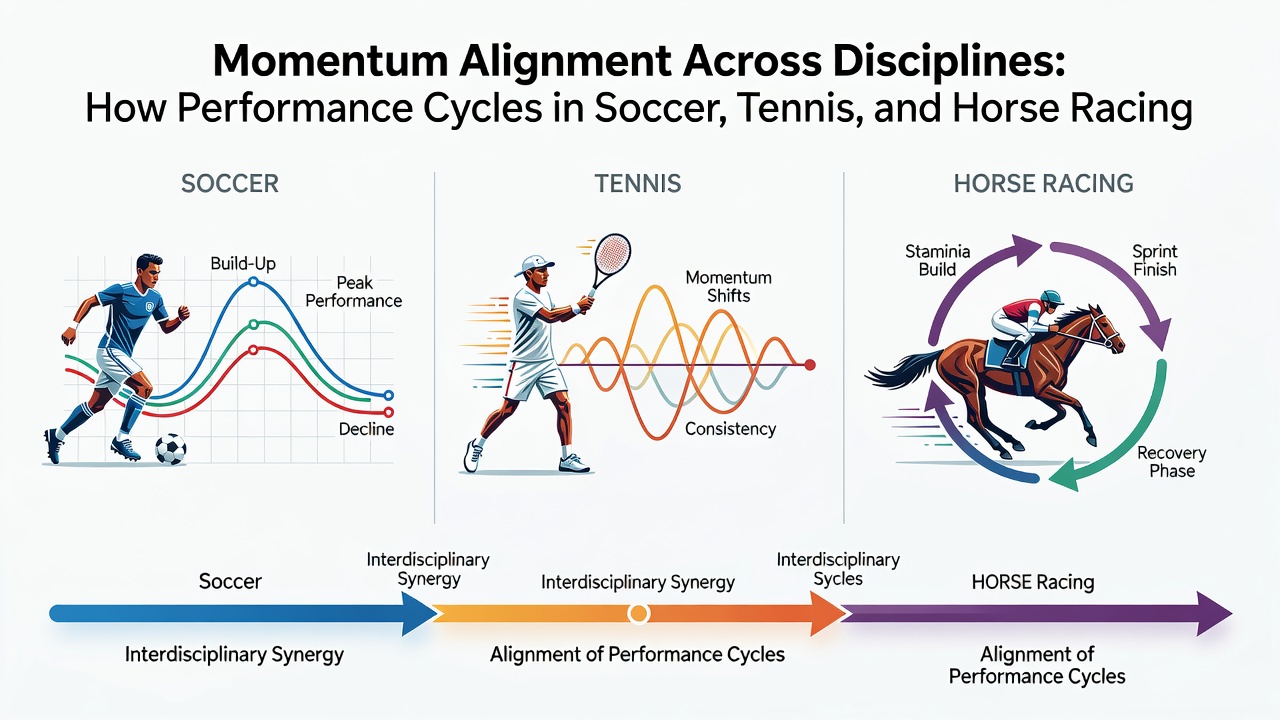
Cross-disciplinary alignment occurs when performance cycles from soccer, tennis, and horse racing coincide within defined time windows, creating opportunities for structured combinations that draw from synchronized form phases. Statistical models developed by sports analytics groups demonstrate that overlapping streaks increase the predictability of individual leg outcomes within multi-leg frameworks, though variance remains inherent due to external factors such as weather, officiating, and participant health. Researchers at institutions including the University of Queensland have examined how circadian rhythm disruptions affect athletes and equine competitors similarly during extended travel periods.
Layered multiple structures organize these aligned cycles into sequential or parallel tiers, where each tier corresponds to a different temporal scale of momentum. Short-term daily fluctuations combine with medium-term tournament or meet progressions and longer-term seasonal trends. Data from international federations and racing authorities show that participants who monitor these layered inputs achieve more consistent selection criteria across extended periods.
Conclusion
Performance cycles documented in soccer, tennis, and horse racing supply measurable inputs that shape layered multiple structures through statistical alignment rather than random selection. Continued collection of granular tracking data across these disciplines supports ongoing refinement of models that identify coincidence windows and regression points. As July 2026 schedules unfold, analysts continue to map how rest, travel, and competitive demands modulate these established patterns across the three sports.